Introducing GeoCOGO
The long-awaited geometrical processing suite is finally here!
GeoCOGO is an exciting new collection of tools available to all Professionally licensed GeoLab users through GeoLab’s Tools tab, and available as a standalone application that can be purchased pending launch of GeoLab2022 and GeoCOGO suite.
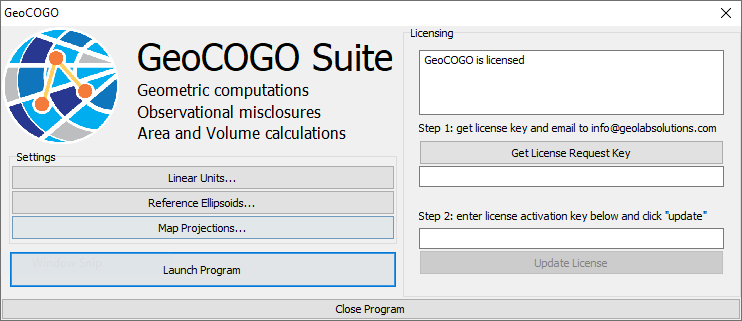
As a standalone application, GeoCOGO provides an interface for managing custom Linear Units, Reference Ellipsoids, and Map Projections. GeoCOGO also provides access to GeoLab’s Classic Import Tools, a standard CSV import tool, and the newer GLImports Custom Delimited Import Tool for importing stations and observations.
To purchase GeoCOGO as a standalone product (meaning you do not need GeoLab), click the below button:
If you have already purchased GeoCOGO as a standalone product and you would like to purchase GeoLab as a complete product alongside GeoCOGO, click the below button:
As a licensed GeoLab Professional user you can access the above tools in their usual location in the Tools tab.
A detailed guide for using GeoCOGO is available in the installation directory in file HelpFiles/GeoCOGO operation manual.pdf. Click the link to download it here.
A detailed guide for using GLImports is available in the installation directory in file HelpFiles/GLImports operation manual.pdf. Click the link to download it here.
Using GeoCOGO
Overall Drawing Controls
Click on drawing point: select a station. If multiple are clicked, a separate dialog will allow you to choose the correct station
Left-click and drag on map: move drawing around on screen
Mouse wheel up/down: scroll in and out of drawing
Right-click and drag: zoom into exact area drawn with dragged box if dragged down-right. If dragged up-left, zoom out proportionally to the same area
F1/F2/F3: add selected station as at/from/to station, line, etc.
Station Database tab

Used to load, modify, and view the stations that will be used in COGO and Area/Volume calculations.
Loading Stations
Stations need to be loaded before any spatial computations can be done. Stations are stored in a "Station Database", which is a folder containing a collection of stations. Any number of station databases can be saved, representing separate projects.
Add a new database...: create a new station database and bring up the GeoLab Station Database dialog
View/Edit: view and manage the current database, or add a new database manually
Database Linear Units: select the input linear units of the station database stations
Database Ellipsoid: select the reference ellipsoid of the input stations
Viewing Stations
Stations can also be viewed on this tab, alongside their locations
Station names: shows all of the stations in the database. Click on one in this list to move to it and highlight it on the map, and show its location. Alternatively, you can click on a point directly on the map to do the same
Coordinate type selection: displays the coordinates of the selected station in either Ellipsoidal (lat/lon/h), Map Projection (N,E,H), or XYZ (X, Y, Z)
Geoid values: displays the N/S and E/W deflections and undulation at each station
Export Stations to CSV File: export the stations to a CSV file
Drawing Controls: move around drawing, zoom in and out, and scale to fit/center on screen.
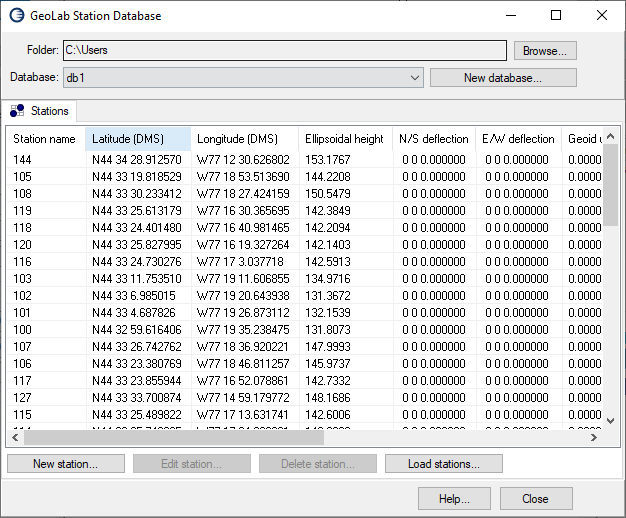
Station Database dialog
This dialog is used to manage a station database and the stations it contains. Controls:
Browse...: change the parent folder containing the station database(s) you wish to view and work on
Database dropdown: choose a database to work on, contained within the parent folder
New database...: create a new database in the parent folder
Stations/Edit Stations control: the Stations tab will show all of the stations in the database, while the Edit Station tab will allow you to edit the information pertaining to a given station.
New Station...: add a new station to the database and edit its information
Edit Station...: edit the selected station
Delete Station...: delete the selected station
Load stations....: open a separate dialog allowing you to automatically load in stations from an IOB file, GeoLab Adjustment, or a CSV File
Calulations Tab

The main tab for performing COGO computations. NOTE that COGO functions on this tab can only be used once Stations have been loaded on the Station Database tab
Options
Measurement type for direct/inverse calculations: Choose the measurement type for direct and inverse COGO computations, from common surveying observations made with total stations, GNSS, etc.
Observation and Output Reference: select the linear units, map projection, and earth ellipsoid for all observations and computed stations
Refraction: add a refraction correction to vertical and zenithal angles where relevant, based on refraction coefficient or arcseconds of error per kilometer
Angle Reference: select the angle reference of all horizontal angles, whether measured in face-left or face-right based on the field orientation of a total station
Azimuth Type: select whether azimuthal observations are azimuths (0-360) or bearings (N30E15, etc.)
Distances Type: select whether distances are measured on the grid or ground, with optional combined scale factor for grid distances
Calculations
Large Observation Type Selection Button: choose the type of COGO operation to perform, based on either setting new stations with geometric observations or finding the observations between existing stations
Station selection windows: select the "at", "from", and "to" stations for each COGO operation as needed. Optionally, you can click these points on the map and press the "add station to..." buttons or F1/F2/F3 to do the same
Measurements: enter the observations required for each COGO observation as needed. Options for azimuth/bearing, degrees/gradians, etc.
Note that this will show the computed observations when using inverse functionsTarget "to" station coordinates: when setting new station(s), this will display their coordinates in either Ellipsoidal, Map Projection, or XYZ.
Station Name: name of the new station to add to the database
Add to database...: add new station to database
Edit station data before adding to database...: modify the station data before adding to database (name, photo, other info, etc.)
Drawing Controls
Drawing controls box: move around, zoom in and out of, and scale/center the drawing on screen
Add Station To...: with a station clicked/selected, add it as the from/to/at station for a given COGO procedure
Clear Selected Stations: clear the from, at, and to stations, as well as the highlighted/selected station from the drawing
Distances: distplay the spatial distances between each of the three stations in an observation (from, at, to)
Closure Tab
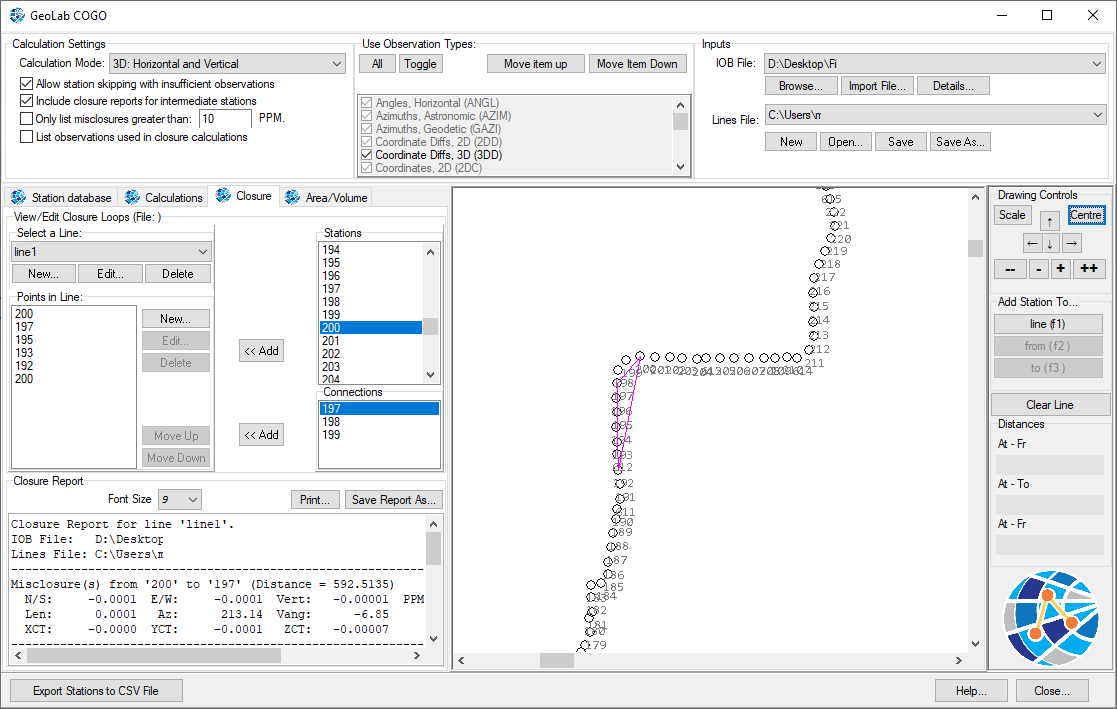
Perform 3D computations on existing stations and field observations to find spatial misclosure values
Options
Calculation Mode: choose the type of spatial misclosure to compute (1D, 2D, 3D)
Allow station skipping with insufficient observations: if a closure loop contains stations with insufficient observations to compute the misclosure, it will be skipped rather than breaking the computation
Include closure reports for intermediate stations: rather than only showing the final misclosure of the loop, show the accumulated misclosure at each intermediate station along it as well
Only list misclosures greater than ___ ppm: leave misclosures below a given ppm value out of the closure report
List observations used in closure calculations: list the input observations used in each misclosure computation
Use Observation Types: toggle the different types of observations present in the input file that you wish to include in the misclosure computation.
If not enough observations are found for a closure report, try including all observationsInputs:Select the input IOB file containg Stations and Observations, and the Lines file containing text files representing each closure loop.
Important note: the stations in Closure are different from the stations loaded for COGO and must be loaded from an IOB file that also contains GeoLab observations between the stations
Also note that you need a lines file and one or more lines to start working with ClosureImport File: Import a file to IOB format using one of GeoLab's many classic import tools, such as Trimble Business Center
GLImports: Make use of GeoLab's custom delimited or fixed-width import tool to import a custom text file to IOB format.
See more about GLImports here: GLImports Custom Import Tool
Closure Report and Lines
View/Edit Closure Loops File (File ___________): this will show the lines file you are working on. If it is blank, add a lines file as mentioned above
Select a Line: select an existing line from the loaded lines file
New...: add a new line to the loaded lines file
Edit...: edit the name of the selected line
Delete...: delete the selected line
Points in Line: all of the current points in the closure line/loop, in order
New...: add a new point to the line based on name
Edit...: edit the name of an existing point in a line
Delete...: delete the selected station/point from the active line
Move Up/Down: move the selected station up or down in its order in the line
Stations/<< Add: all of the stations in the network. Press << Add to add the selected station to the line.
Alternatively, click a point on the map and press Add Station To... line (f1) to do the sameConnections/<< Add: when a station is selected, all of the available connections based on the selected observation types and field observations loaded. Click one to add it to the line or click it on the map and add as mentioned above
Note that when a station is selected, all available connections will show in this box and as secondary highlighted points on the mapClosure Report: view generated closure report based on stations in selected line. Additionally, send report to printer or save as a text file.
If you would like to change the way the report is generated, modify the OptionsClear Line: clear all points from selected line
Area/Volume Tab
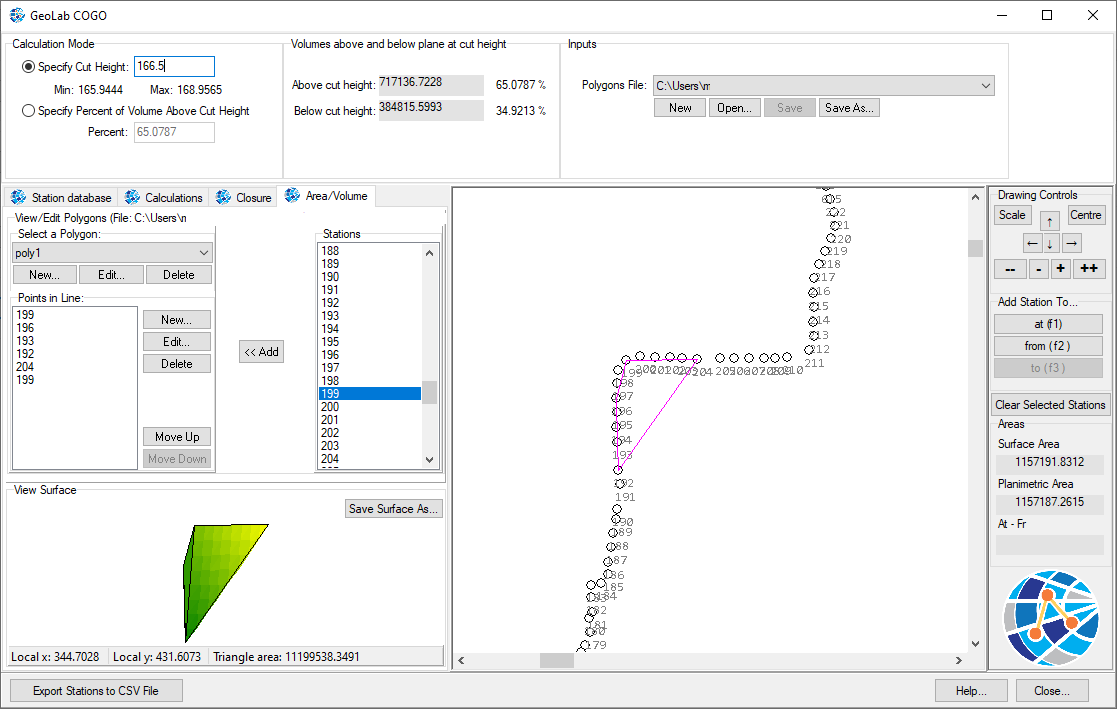
Perform various computations to find 2D planimetric/surface area and 3D volume throughout stations loaded in Station Database tab (same stations used in COGO)
3D Volumetric Options/Computations
All linear units will be those provided in Calculations tab
Calculation Mode: calculate volume in drawn polygon based on volume above cut height in linear units or percentage of volume above cut height
Volumes above and below plane at cut height: 3D volumes, in linear units, above and below cut height alongside percentages of total volume
Polygons File: text file containing polygons. A file must be specified to use this tool
Polygons View/Edit and 2D Area Computations
View/Edit Polygons File ___________: this will display the active polygon file. If it is blank, load in a file as mentioned above
Select a Polygon: select a polygon in the Polygons file to work on
New...: create a new polygon in the selected Polygons file
Edit...: edit the name of the selected polygon
Delete...: delete the selected polygon
Points in Line: all points currently in selected polygon. The order does not matter
New...: add a new point to the polygon based on name
Edit...: edit the name of a point in the polygon
Delete...: delete the selected point from the active polygon
Move Up/Down: move the selected point up/down in the list
Stations/<< Add: select a station from the list and click << Add to add it to the polygon.
Alternatively, click a station on the map and click Add Station To... polygon (f1) to do the sameView Surface: view the generated 2D Triangulated surface. Click Save Surface As... to save as an image.
You can click each individual triangle on the surface to add or remove it from the total area computation(s)
Hovering over the surface will show the area of each individual triangleClear Polygon: clear all points from selected polygon
Areas: displays the surface and planimetric area(s) of the generated surface, minus any triangles removed with the above method